A History of Electricity Rates
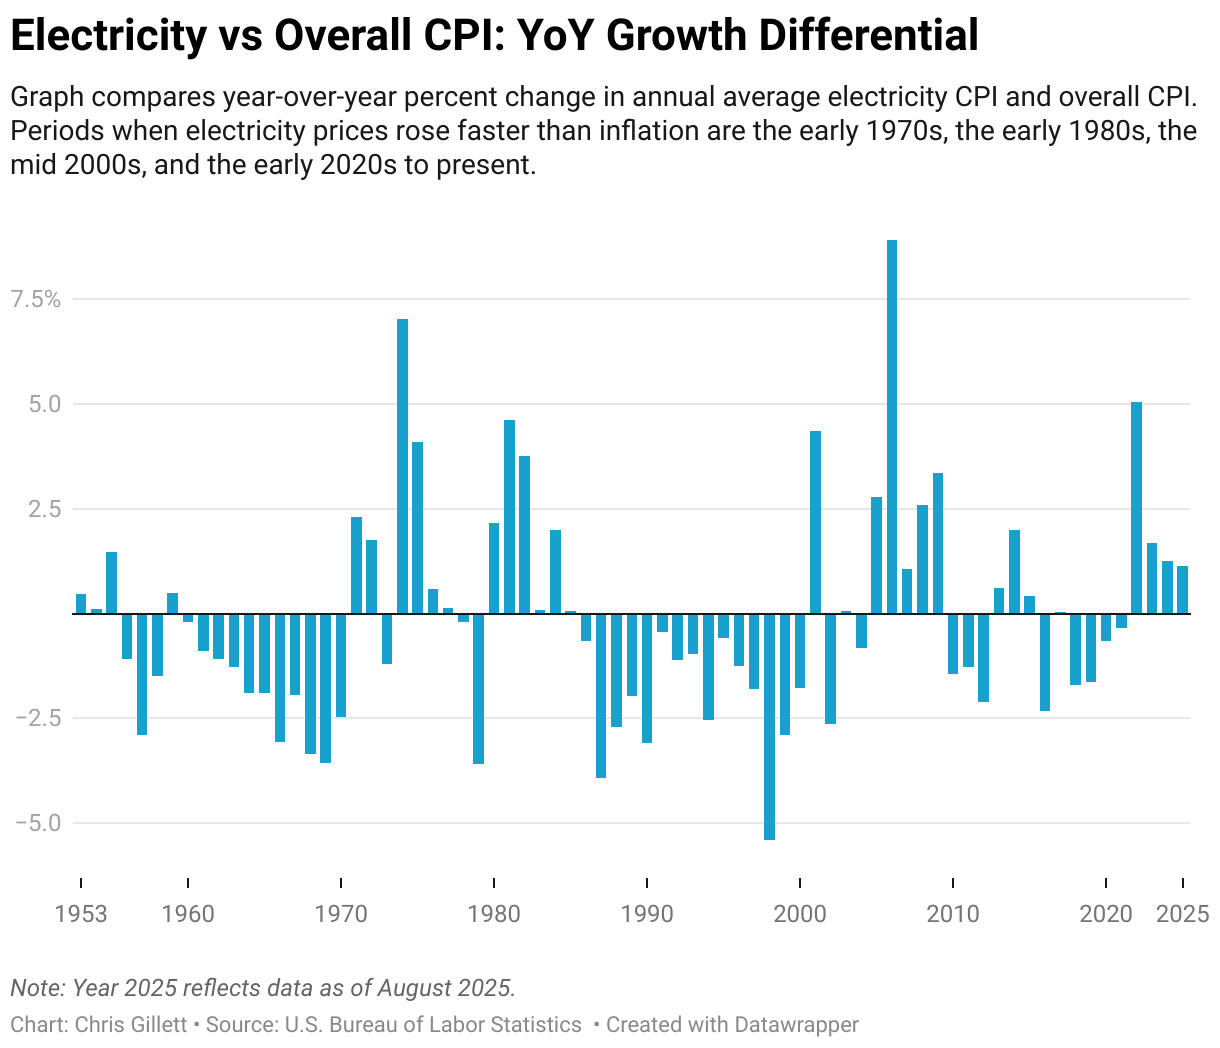
There have been four periods in U.S. history when electricity rates rose faster than inflation: the early 1970s, the early 1980s, the mid 2000s, and the early 2020s.
This chart compares the year-over-year percent change in overall CPI and electricity CPI. Positive values are years where the cost of electricity grew faster than overall prices.
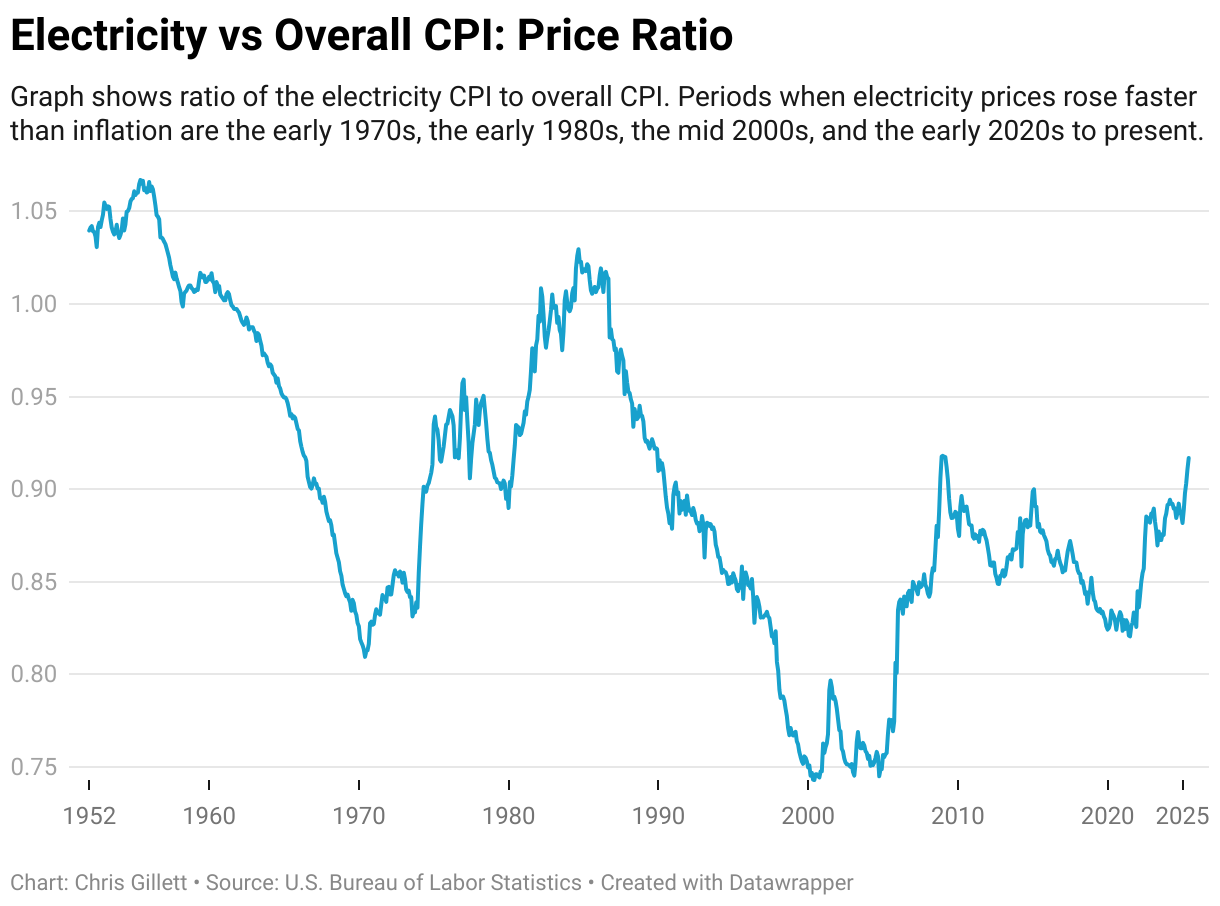
For a more cumulative perspective, this graph plots the ratio of electricity CPI to overall CPI. When the line rises, electricity is getting more expensive relative to overall prices.
The early 1970s
For the entire history of the electric power industry, power prices were getting cheaper year after year. In 1892, the average residential electricity customer paid $4.53/kWh (in 1996 dollars), but this fell quickly to $0.62/kWh in 1927, $0.47/kWh in 1937, $0.22/kWh in 1947, and finally $0.09/kWh in 1969.
These savings were first driven by network effects. As more customers joined the grid (or as neighboring grids were interconnected) the utilization of power plants increased, amortizing the fixed cost of those assets over more users, allowing for price reductions. Additional savings were found in economies of scale of power plants. As the capacity of plants increased, their marginal cost of production decreased, lowering utilities’ costs.
By the late 1960s, these tailwinds had slowed. The impact of network effects tapered off as the industry entered post-war maturity, and by coincidence power plant designers were approaching fundamental limits in turbine efficiency at around the same time. But the most significant factor by far that contributed to the rise in electricity prices in the 1970s was the oil shock.
In the 1950s and 1960s, it seemed that the easily accessible oil had been drilled, and exploration for new oil had turned to increasingly more costly and environmentally sensitive areas, like Alaskan wilderness or off the Pacific and Gulf Coasts. And fuel demand boomed along with postwar American consumerism. But the federal agencies that had largely set fuel prices since the New Deal failed to increase prices to reflect these pressures. The result was under-investment. In 1956, the number of exploratory wells dug peaked. And in 1968 oil exploration had fallen to such a low level that more oil was consumed than new oil (in reserves) was discovered. Inventory drawdown had begun.
For the first time since the hydrocarbon revolution had brought about the modern world, an expiration date for that modern world was now in view - the date when the last reserves would be depleted. American leaders were chastened. Around that time, three highly influential books were published that meditated on the theme of resource scarcity: “The Population Bomb” (1968), “The Limits to Growth” (1972), and “A Time to Choose: America’s Energy Future” (1974).
Under-production was made up for with imports. Net oil imports doubled from 1970 to 1973 to make up 36% of total U.S. consumption. But in 1973, OPEC countries cut off their oil exports to the United States in response to our support for Israel in the Yom Kippur War. This quickly resulted in widespread shortages of fuel in the U.S.
The oil shock is one of the most significant events in American economic history. It was widely compared to Pearl Harbor, at a time when Pearl Harbor was not a distant memory. People were killed in fights that broke out in the long lines at gas stations. Truckers went on strike, shutting down interstates with their trucks. And to enforce that strike, some of them attacked non-striking trucks, including by shooting rifles at them from overpasses. Riots broke out in Levittown, the car-dependent “icon of postwar suburbia”, in which 169 people were arrested. Shortages, and unrest, continued off-and-on throughout the 1970s. (And to save you a Google search - yes, the first Mad Max film was released in 1978.)
The most significant consequence of the 1970s energy crisis was that it shattered confidence among American leaders in the New Deal regime of price controls. They turned instead to Neoliberalism. President Carter largely removed fuel price controls and deregulated fuel-dependent industries like airlines and trucking. The New Deal coalition, which had been strained on its right by the Civil Rights movement and on its left by Vietnam, fell apart.
For our purposes, the most significant impacts of the crisis were rising electricity rates, partial utility de-regulation, the mainstreaming of energy conservation, and shifts in power plant investment.
Despite the controls, natural gas prices increased through the 1970s and as a result so did electricity rates. From 1969 to 1979, the average residential electricity rate had doubled from $0.021/kWh to $0.044/kWh (unadjusted). The electricity CPI measure doubled over that period also. This was the first period when electricity prices ever rose significantly.
Implications for utility regulation
One policy response to the energy crisis was the Public Utility Regulatory Policies Act of 1978. It aimed to promote energy efficiency and non-traditional power generation technologies. But its most lasting impact was to partially deregulate the utilities industries by allowing independent companies to build certain kinds of fuel-efficient power generation resources - biomass, waste, renewable, and co-generation - in the territory of regulated utilities. Regulated utilities were required to buy the power that those facilities.
PURPA opened to door to full deregulation by discrediting the assumption that power generation was a natural monopoly. It showed that independent companies could be cost-competitive with regulated utilities, and it created a framework for them to interconnect their own resources to the grid.
The 1970s also brought energy conservation into the mainstream. Previously, U.S. energy leaders had felt that more electricity usage was always good because increasing utilization of fixed cost power generation assets could lower costs. But now that there was a shortage of fuel, there was no choice but to encourage energy conservation.
Beginning in the early 1970s, Americans were told for the first time to turn down their thermostats, to use less hot water, and to turn off the lights before leaving the house. The utilities established conservation departments and distributed booklets encouraging household energy conservation measures.
Following several state laws, a maximum speed limit of 55mph was set nationwide in 1974 and not raised until 1987. Nixon requested gas stations to close on Sundays to discourage weekend roadtrips, and several states enforced this by law. Cars got smaller. Carpooling was patriotic, and Christmas lights were not. To show their sensitivity to the energy crisis, the Daytona 500 shortened their race to 450 miles in 1974.
The early 1980s
The rate increases of the 1980s were different from the increases of the 1970s. In the 1970s, rates were driven by soaring fuel prices resulting from fuel supply constraints. In the 1980s, rates were driven by huge capital investments that largely didn’t pan out. These investments were began in the 1970s, in response to the fuel crisis.
Facing an indefinite period of oil and gas shortages, a number of energy alternatives received government support in the 1970s. Renewable power and synthetic fuels first received government support during this period, but only as speculative basic R&D projects. Energy efficiency and conservation was also a major project, as we’ve discussed, but it would only go so far.
If electricity usage was to continue growing in the 1970s and 1980s as it had in the 1960s, which was what everyone expected, new power generation capacity needed to be built. And in the 1970s, the only viable power generation technologies that didn’t require oil or gas were coal and uranium.
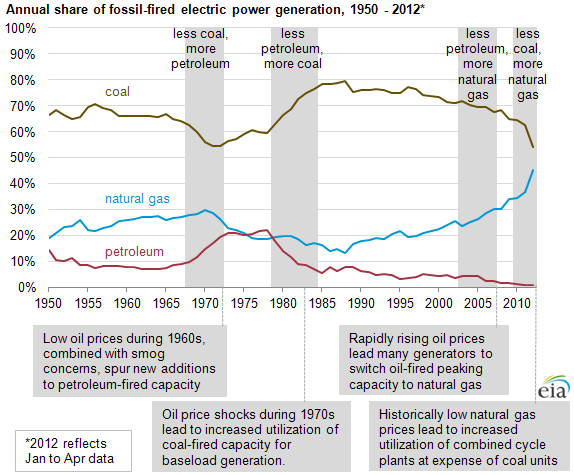
Coal had been losing share of generation since the mid 1950s, and thousands of mines had been closed, in large part because of growing public concern about air quality causing utilities to shift towards cleaner-burning oil-fueled power generation. But after the oil shock, utilities switch their focus back to coal.
Although coal was the workhorse from the 1970s, the 1970s were nuclear’s time to shine.
Utilities hadn’t show much interest in nuclear power since it was made available to industry in 1954, preferring to stick with tried-and-true gas- and coal-fired technologies as those fuels were still inexpensive. The few plants built in the 1950s and early 1960s were expensive demonstration projects that relied on significant government support. The next batch of nuclear starts came in the mid 1960s when the two nuclear manufacturers, General Electric and Westinghouse, built plants at significant losses to stimulate utilities’ interest.
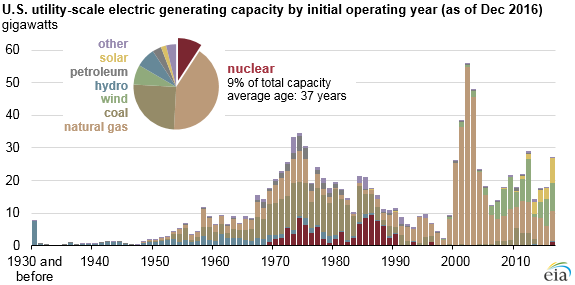
Nuclear orders exploded in the late 1960s. Over the preceding 10 years, utilities had gained nuclear operating experience and costs were approaching a range where they were comparable to coal. Electricity consumption was growing at an enormous pace, but by the late 1960s the oil and gas supply picture had begun to sour and the environmental movement was starting. As previously mentioned, coal capacity had been declining due to the nascent environmental movement. Nuclear was seen as a potential resource of the future that could meet baseload requirements while hedging fossil fuel costs while providing clean air benefits. Almost all nuclear capacity ever built were those projects planned from 1965 to 1973.
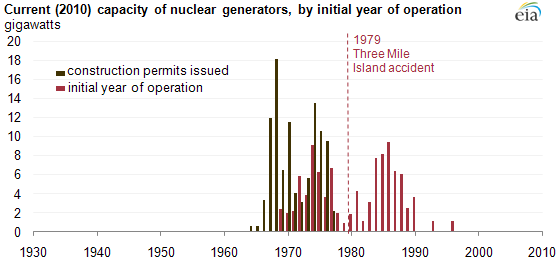
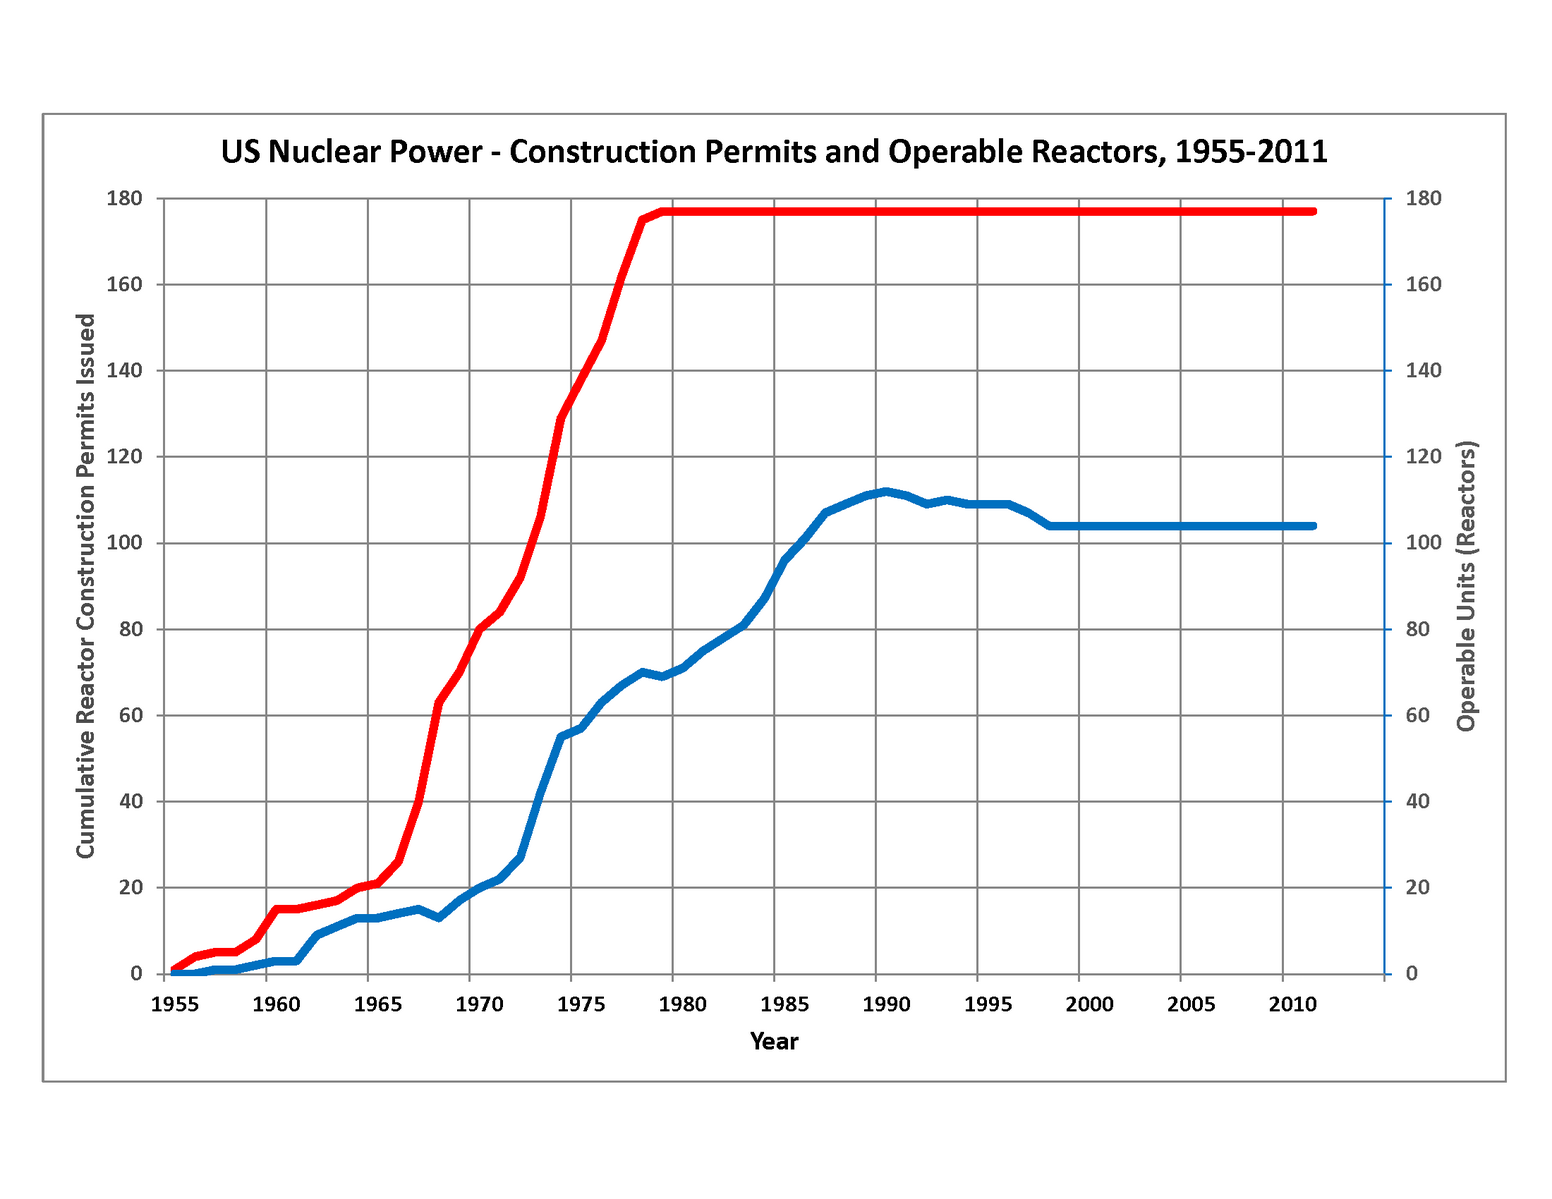
The nuclear bust
When the energy crisis began in 1973, there was a second wave of nuclear orders as Presidents Nixon, Ford, then Carter made nuclear a cornerstone of their energy strategies. But these nuclear projects were financial disasters. Not one of the 41 reactors ordered after 1973 was built.
The energy crisis brought high inflation and borrowing costs, while slowing economic growth and with it projections of future power demand. Meanwhile utilities faced deteriorating financial conditions as their fuel costs increased. Nuclear orders dropped abruptly from 1974 to 1975 with the nuclear trade magazine Nucleonics Week writing in January 1975 that utilities had “no idea how to finance nuclear plants.”
Over the following 10 years, construction timelines increased as accidents at operating plants revealed problems requiring redesigns and retrofits. With the most creditworthy utilities paying 17.5% on their bonds, these delays were extremely expensive. A Department of Energy study in 1984 found that 77% of operating nuclear plants had cost overruns of 100% or more.
And many, many plants were never finished. Environmental groups, which had been neutral on nuclear, come out against it in the mid 1970s, with the Sierra Club first taking that position in 1974. The Three Mile Island accident in 1979 required a new round of redesigns and retrofit. Perhaps more significant to the economics of nuclear, fuel prices began to decline in 1980 and in 1981 the Power Plant and Industrial Fuel Use Act of 1978 was repealed, end a ban on new gas-fired power plants. The TVA abandoned $4 billion of investments in planned nuclear plants in 1984.
Any normal company would have been bankrupted by the delays, cost overruns, or writeoffs that the utilities faced as a result of their bad nuclear investments. But power utilities were regulated monopolies. They could always pass the cost of these failed investments on to the public. And they did. As nuclear costs began to be reflected in electricity rates, prices continued to grow, even against a backdrop of easing inflation and easing fuel prices.
(However utilities are not immune to liquidity shortfalls, and some experienced severe financial destress when they were slow to get rate increases. In 1983, the Washington Public Power Supply System defaulted on $2.25 billion of bonds. PSNH, the largest power utility in New Hampshire, went bankrupt in 1988 - the first utility bankruptcy since the late Depression years.)
Although these price increases were extremely unpopular, they were absorbed by the public over time. By the mid 1980s price began to fall relative to inflation as fuel prices remained low until the 2000s. The next significant change in utility regulation was the Energy Policies Act of 1992, which significantly expanded competition in wholesale power generation and allowed states to begin retail electricity competition.
The mid 2000s
The next rise in electricity prices came during a general inflationary episode from 2005 to 2009, in which energy prices rose faster than overall inflation. A 2006 Brattle report found that increased fuel costs accounted for ~95% of cost increases (and therefore rate increases) in the preceding 5 years.
The prime mover of this period of rising rates was likely a sudden rise in oil prices. Oil prices had been growing steadily in the early 2000s after ~25 years of stability. Then from August 2007 to June 2008, the price of oil jumped suddenly by ~60%.
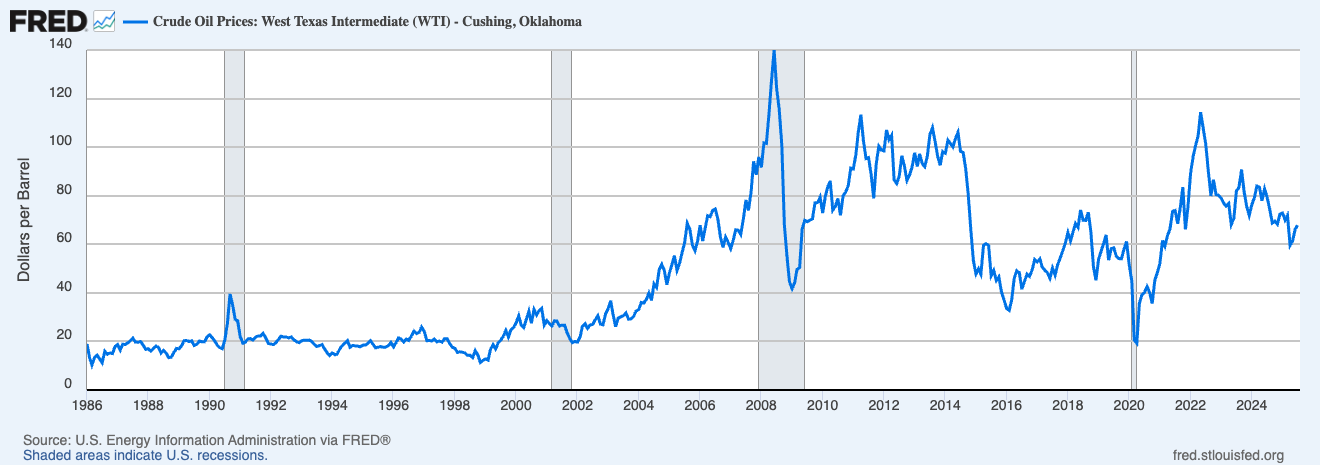
This was one of the biggest oil shocks in history. But it’s unique for being the only oil shock that didn’t involve a disruption in supply. Instead, what occurred was a failure of production to increase to meet growing demand.
China had been experiencing significant growth on a percentile basis for many years, but in the early 2000s they’d grown large enough to be globally significant. From 1992 to 2007, China went from being a net exporter to being the world’s third largest oil importer, with most of that growth happening in the early 2000s. Because of demand from China, global oil demand grew significantly in the early 2000s.
But for some reason, production didn’t increase to meet this demand and keep prices stable. Production had been declining at major oil fields in the U.S., the North Sea, etc. The Saudis had been the swing producer keeping prices stable, but for whatever reason they didn’t in the early 2000s. The result was rising prices.
Because all fossil fuels are substitutes for each other to varying degrees, the oil shock was reflected in the price of coal and natural gas. These increased fuel prices came to be reflected in electricity rates in the mid to late 2000s.
Although it was a major shock in terms of price, it didn’t have the political and cultural impact of the 1970s shock because there were no shortages. The long lines at gas stations were what made the 1970s oil shocks so toxic, and because the 2005-2008 shock occurred in a price de-control regime, there were no shortages. Still, there was a political response in the form of the Energy Policy Act of 2005, which promoted energy efficiency measures and alternative power generation technologies.
The 2008 financial crisis brought a severe pullback of economic activity that collapsed fuel prices and depressed electricity load growth. Electricity rates entered a period of over 10 years of declines relative to overall inflation on average. And due to slow economic growth and energy efficiency investments, electricity load remained almost completely flat from 2005 to 2020.
2022 - present In 2022, electricity rates began to rise again. That is discussed in another post.