Implications of Rising Electricity Rates
Note: Opinions my own. This article is about a nation-wide trend, and I don’t single out any RTO or utility.
Retail electricity rates are rising
That can be seen clearly in this monthly graph of the national average electricity rate:
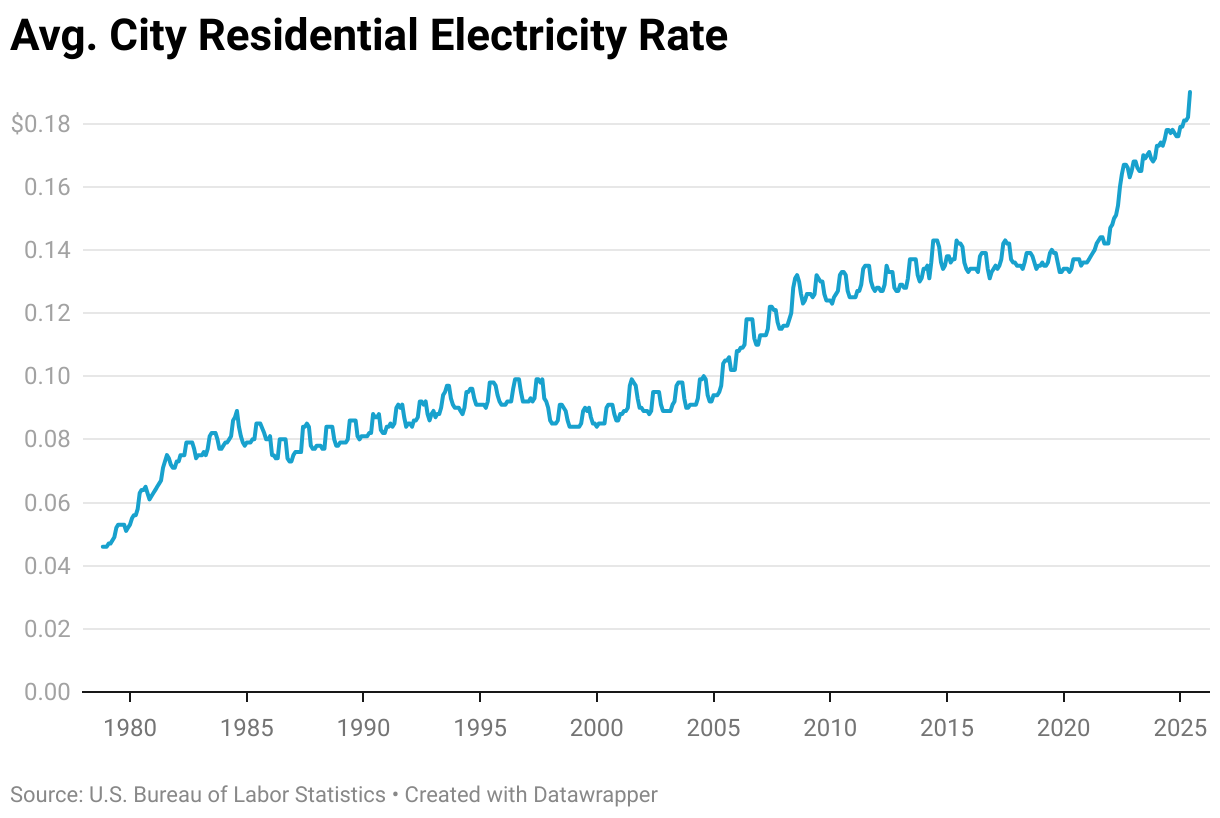
The dataset ranges from November 1978 to present, and over that whole period the compound annual growth rate (CAGR) has been 3.09% (growing 313.04% in total). Since Jan 2020, the CAGR has been more than twice that at 6.66% - a figure with ominous portends.
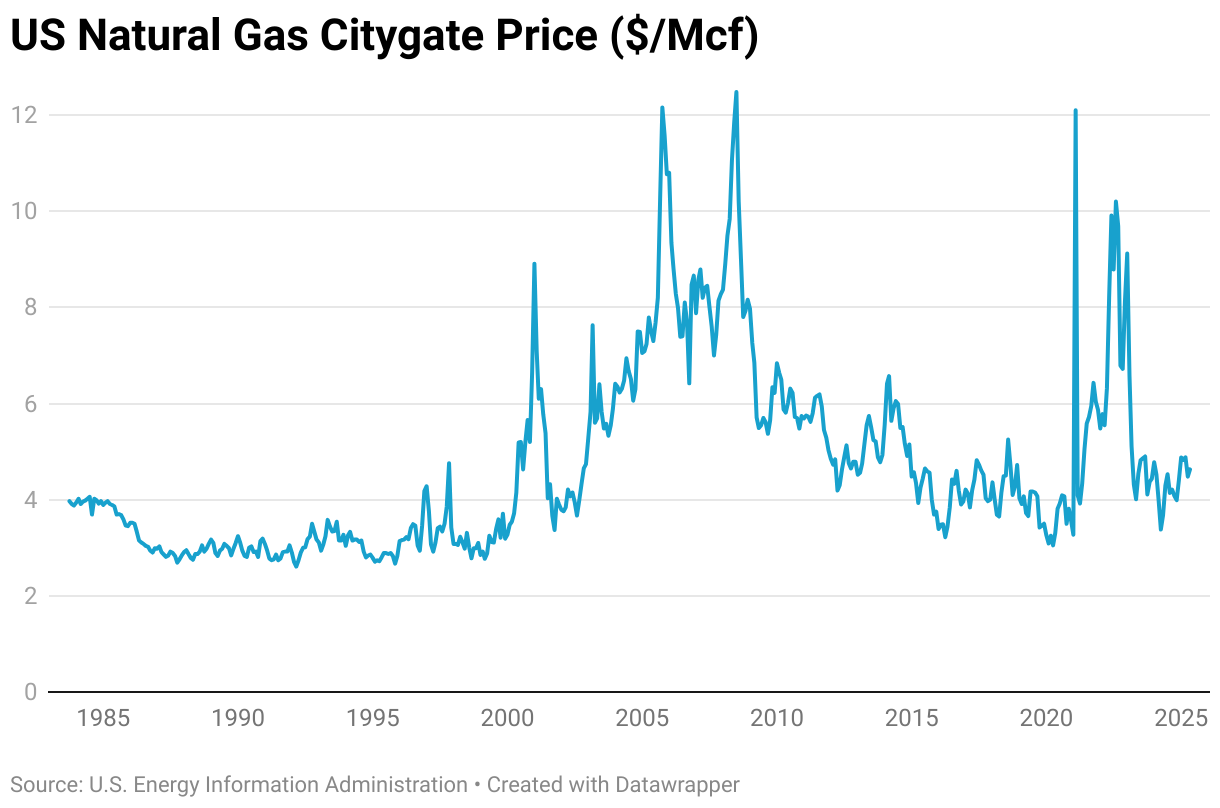
This post-2020 price growth has a few distinct periods. In the year 2022, prices spiked 14.29% (for a CAGR of 14.29%, of course) because natural gas prices spiked after Russia invaded Ukraine in February 2022. Natural gas prices returned to their original level in May 2023.
The periods before and after the 2022 spike, 2020-2022 and 2023-2025, had growth rates somewhat higher than the historical average at 4.75% and 3.22% CAGR respectively. But so far in 2025 electricity prices are spiking harder than they did in 2022, with a CAGR of 15.39% so far this year (as of June).
And electricity rates will probably continue to rise. Many of the rate increases that have begun in 2025 include additional increases to be phased in over future years, and other utilities are considering their own new rate increases.
Why rates rise
Before discussing the drivers of electricity rate increases today, let me briefly explain how utility rates work and give historical context on past periods of rising rates.
There are multiple components that go into the final $/kWh rate. There’s a regulatory charge, which pays for the transmission and distribution (T&D). It’s the “regulatory” charge because it’s set by the state regulator, who approves T&D expenses and charges a rate that will allow the T&D Utility (a.k.a TDU) to recoup that expense plus a profit.
Then there’s the rate which pays for producing the electricity and other utility expenses. Typically there’s a flat $/kWh rate, or tiered rates that increase as your usage increases, or time-of-use rates that have different rates at different times of the day. Some utilities (typically co-op or municipal-owned) pass through their fuel costs. These charges add up to one $/kWh rate that the customer is charged for their usage.
Retail rates rise when utility costs increase. These cost increases could come from operating expenses (e.g. rising natural gas or wholesale power prices) or capital expenses (e.g. building new power plants or T&D). Capital expenses come from routine replacements of aged equipment, expanding the system to connect new customers, and construction of new generation to serve increasing load. Economy-wide inflation impacts both O&M and capital expenses.
History of electricity rates
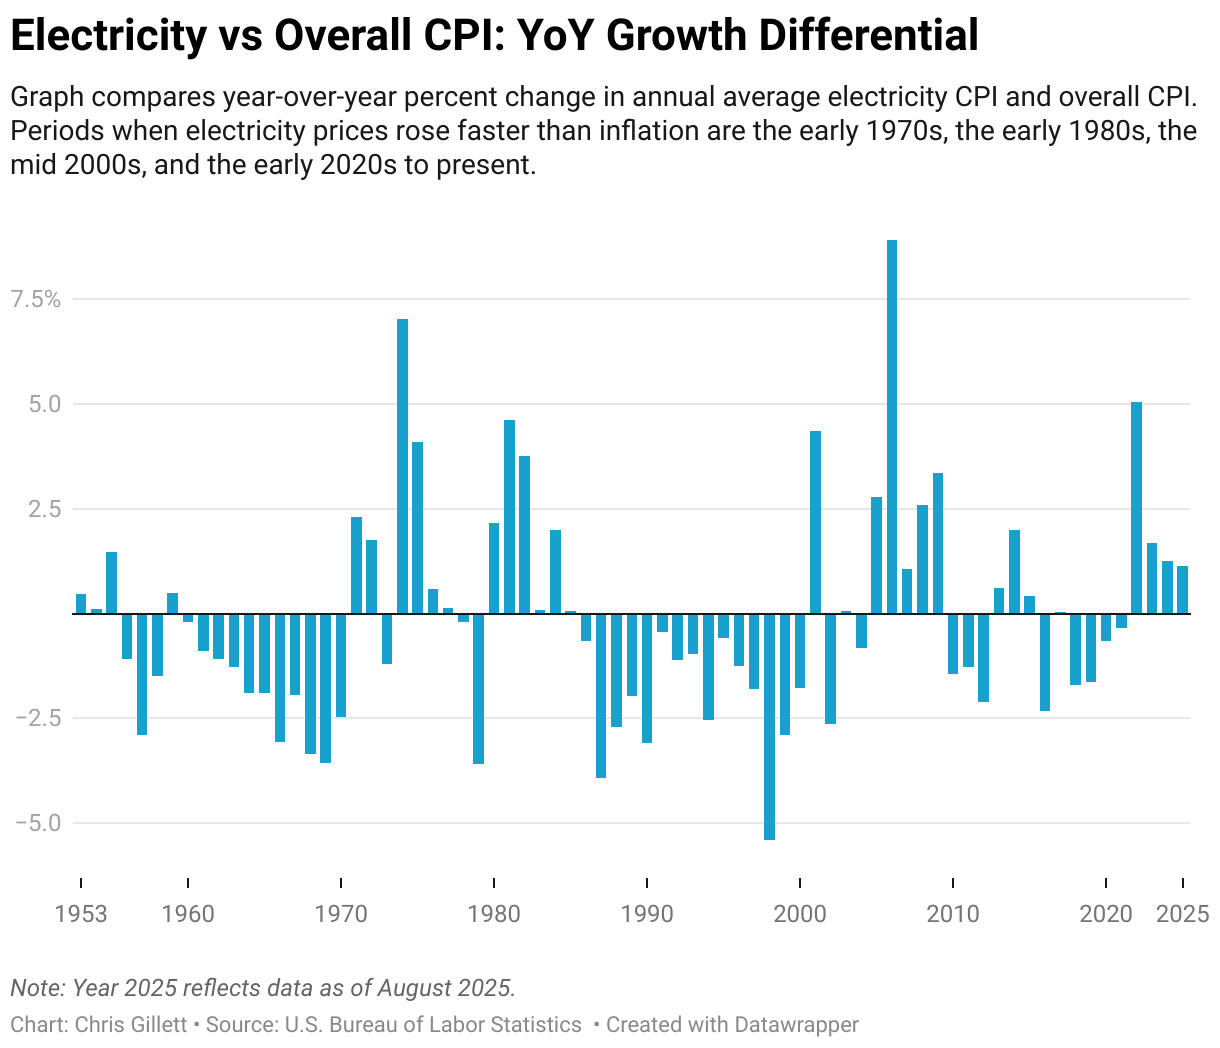
Prior to the current one, there have been four periods in U.S. history when electricity rates rose faster than inflation: the early 1970s, the early 1980s, the mid 2000s.
This chart compares the year-over-year percent change in overall CPI and electricity CPI. Positive values are years where the cost of electricity grew faster than overall prices.
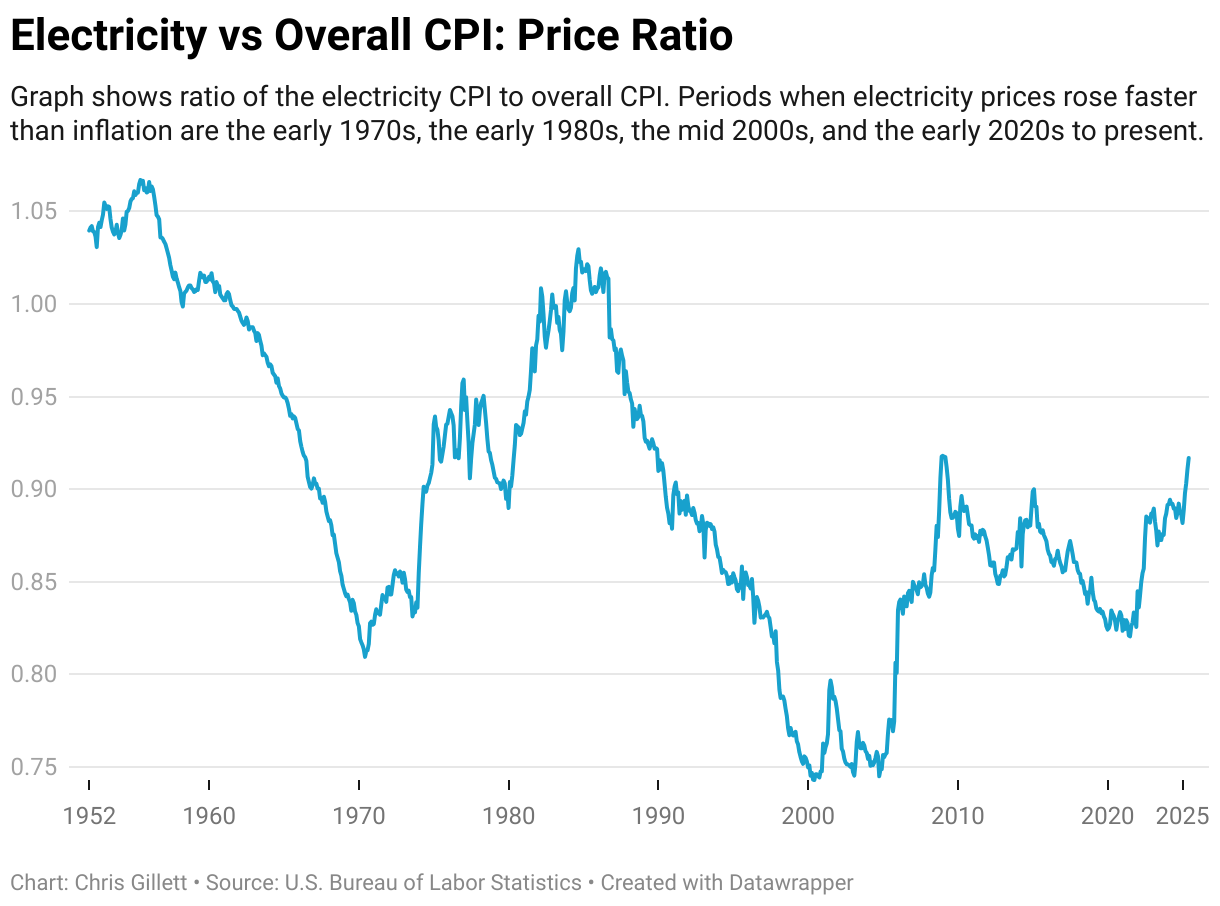
For a more cumulative perspective, this graph plots the ratio of electricity CPI to overall CPI. When the line rises, electricity is getting more expensive relative to overall prices.
In the 1970s, under-investment in oil exploration resulted in recurring shortages caused by overseas supply disruptions. This deeply shocked American leaders and the public, and it had sweeping consequences for American energy policy. The stark reality of the energy limits to growth shaped the psychology of the nascent environmental movement. The utility industry was partially deregulated, with independent companies now allowed to build power plants and sell power to the regulated utilities.
To hedge against rising fossil fuel prices, utilities invested in nuclear power projects that experienced extreme delays and cost overruns. All nuclear plants permitted after 1973 were ultimately canceled in the face of the inflation, high interest rates, deteriorating utility finances, and slowing economic growth and therefore power demand brought by the energy crisis. The cost of these expensive projects resulted in another period of electricity rate increases in the early 1980s, which began to look absurd against a backdrop of an oil glut and easing inflation. This was a significant contributing factor to the eventual total deregulation of wholesale power production in the 1992 Energy Policies Act.
Finally, there was a period of rising electricity prices in the early 2000s caused by an oil price shock. Unlike previous shocks, there was no supply disruption. Instead, the rapid growth of China - who went from being a net exporter of oil in 1992 to the third largest importer in 2007, with most of that consumption growth coming in the 2000s - significantly increased worldwide demand. But for whatever reason, production couldn’t rise to meet the demand and prices rose considerably. These fuel price increases were reflected in electricity rates in the 2000s.
The 2008 financial crisis collapsed fuel prices and, along with investments like energy efficient lightbulbs, depressed electricity demand until 2020. That brings us to today.
Today’s drivers of rate increases
Looking at actual spending in recent years, a few things stand out to me.
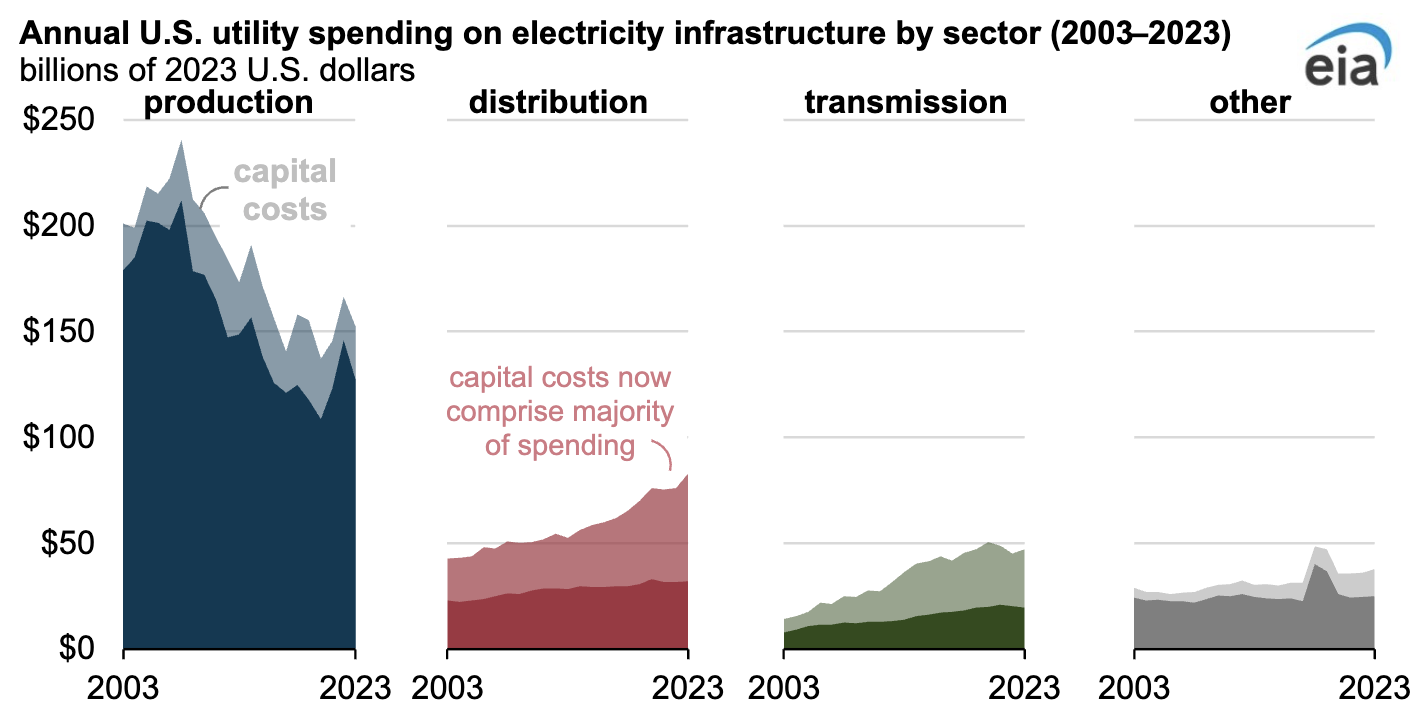
The spike in O&M expenses for power production in 2022 is clearly due to the spike in natural gas prices as a result of the war in Ukraine. These expenses fall in 2023 and are now back to $3.02/MMBtu as of June 2025. Natural gas prices don’t explain the continued rise of electricity prices in 2025.
The two categories with the most consistent growth are transmission and distribution capital expenses. These expenses are caused by the replacement of aged equipment and by system expansion as new customers are connected.
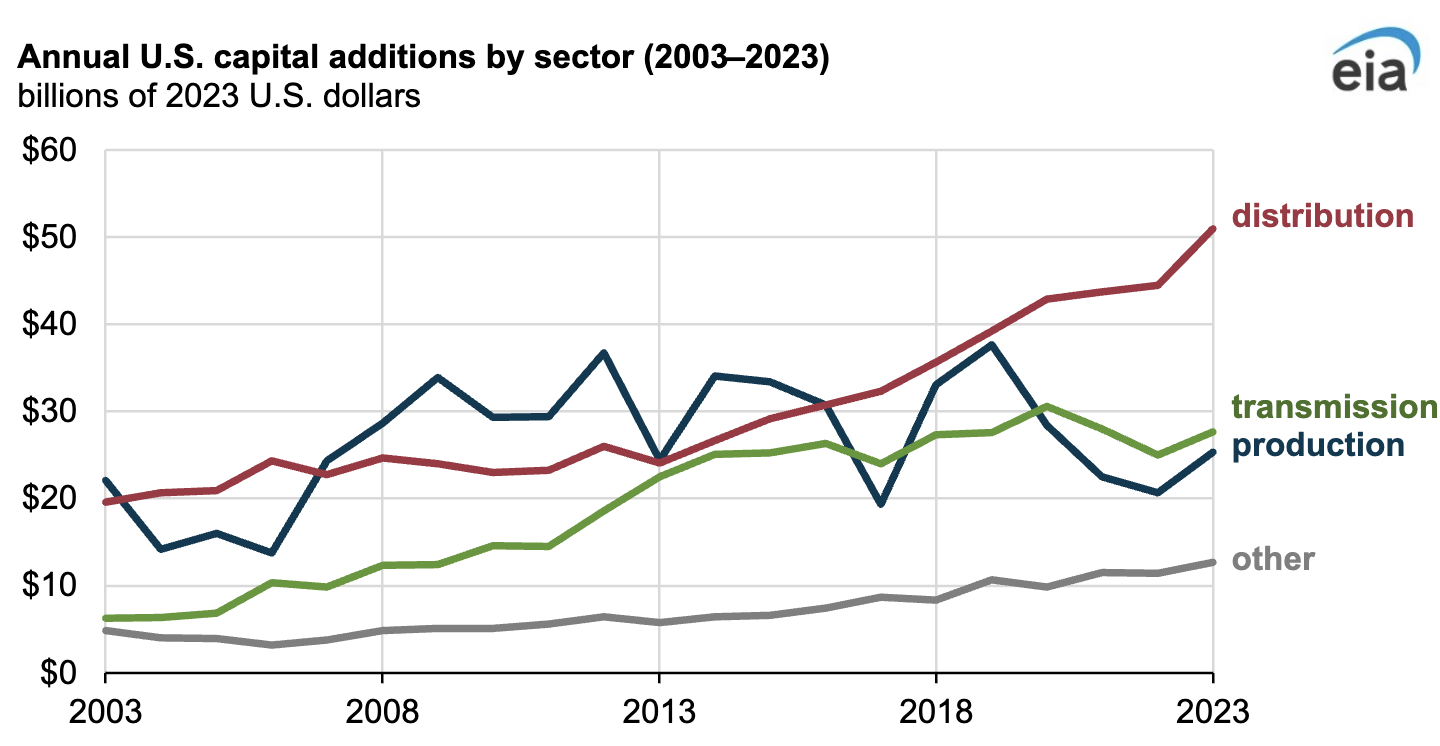
Although my perception is that there’s been increased interest in ‘smart grid’ and distribution resiliency investments in recent years, I think that the amount of distribution investment is largely the same but growing on a dollar basis due to inflation.
There’s no one data series that tracks the costs faced by utilities, but one highly indicative one is the PPI for electrical equipment manufacturing.
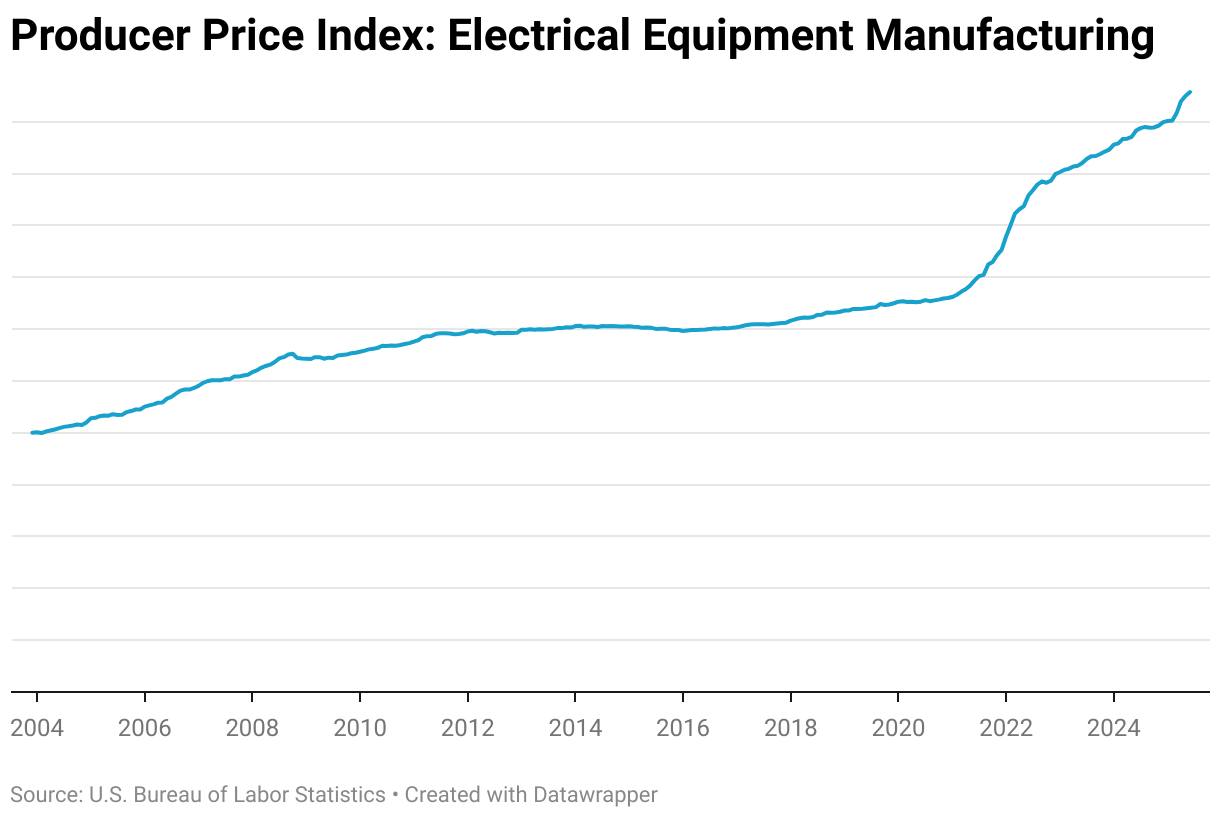
While overall CPI has grown at a compound annual growth rate of 4.06% since 2020, the producer price index for electrical equipment manufacturing has grown 8.26%.
There will also be increases in the rate of transmission investments in coming years. In Texas, $48 billion in transmission projects have been approved for construction that aren’t yet reflected in retail rates. While Texas may be an extreme case because of the amount of grid investments occurring there, it indicates a nationwide pattern.
There is likely to be increased need for transmission across the country in the coming years as both new generation and new loads are likely to be in more remote areas.
The vast majority of new generation resources are expected to be renewables, which tend to be sited in remote areas because they require large swaths of land and because the windiest and sunniest parts of the county happen to be in less populated areas. Since those areas tend to have less grid infrastructure built out, there is a continuing need for building new transmission.
On the load side, the large new data centers loads being interconnected require transmission investments also. While these loads tend to choose to site near existing power infrastructure, they could theoretically be built anywhere. This would break the historical pattern of load building near other existing load, and it would necessitate further transmission investments.
It’s important to understand that unlike power generation, transmission and distribution services are still fully regulated and their costs are still socialized across the system. Regulators approve projects based on forecasts for future loads, and whether or not their forecasts are correct, the public pays. This is the “regulated” charge on your bill. The share of this regulated charge on customer bills has increased since the start of electricity deregulation in Texas.
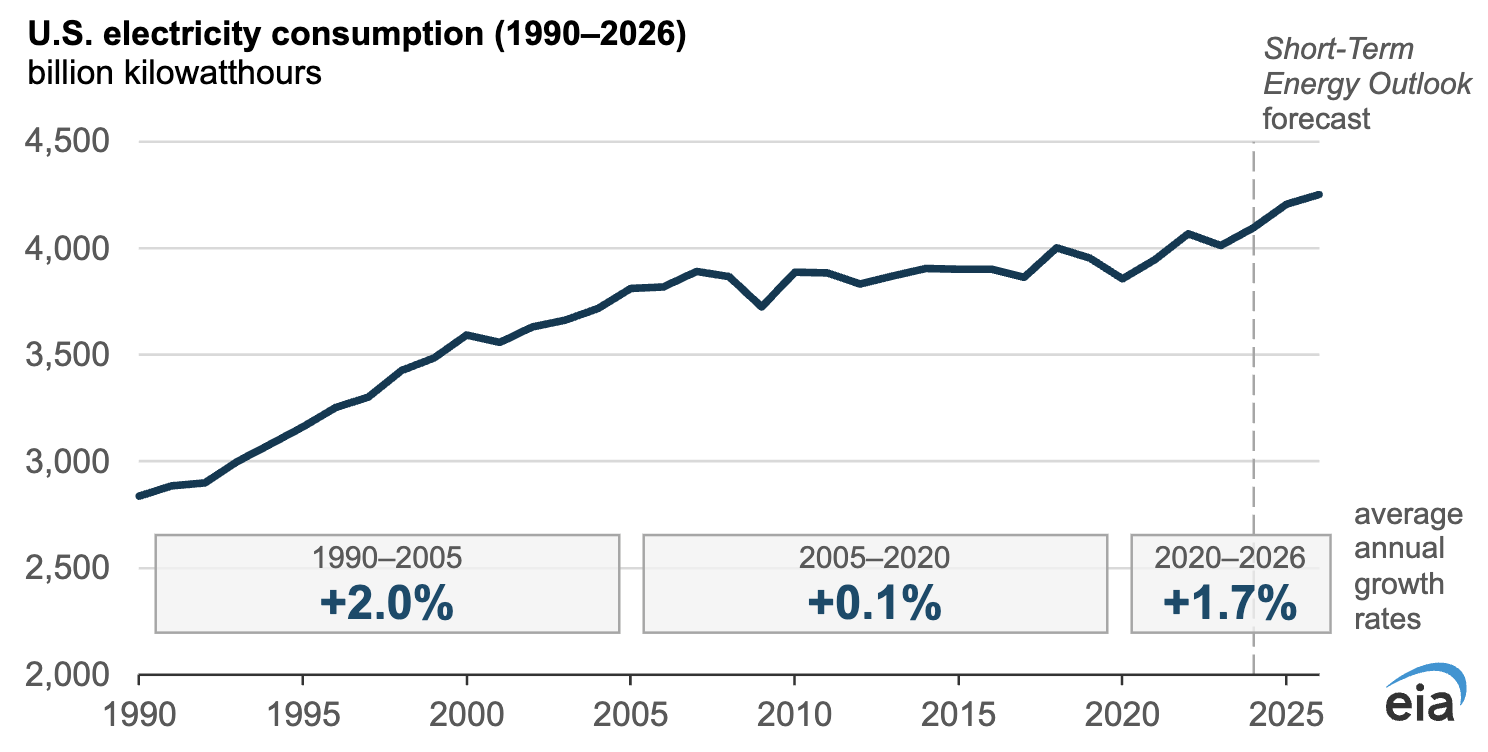
In the above chart of actual utility spending, there isn’t an increased in capital expenses for power plants. But that’s because the chart stops in 2023. After almost 20 years of almost no load growth on the grid in the U.S., electricity usage has started to increase and is projected to increase significantly. This will necessitate investments in new capacity.
The cost of those capacity investments has likely increased much faster than inflation. Utilities around the country and the world are now looking to invest in gas-fired generation resources at the same time. The demand to build far exceeds the capacity of manufacturers to make turbines. The result is increased lead time and prices.
So far, turbine producers have been cautious to increase turbine production capacity. Power generation development is a boom and bust industry, and the manufacture of inputs to that industry is even moreso. This is the subject of a famous Michael Porter HBS case study “General Electric vs. Westinghouse in Large Turbine Generators”. A similar bust occurred in the early 2000s. Turbine makers are therefore reluctant to invest in production capacity that may go underutilized in another bust.
Of course if these capacity investments are not made, electricity prices will still increase. Instead of increasing to pay off capital costs, electricity rates will increase to reflect the higher average wholesale power prices that will result from more frequent scarcity conditions if generation capacity is inadequate to meet growing load. Wholesale prices reflect not just fuel prices but also the frequency of shortages, and retail prices eventually reflect wholesale prices.
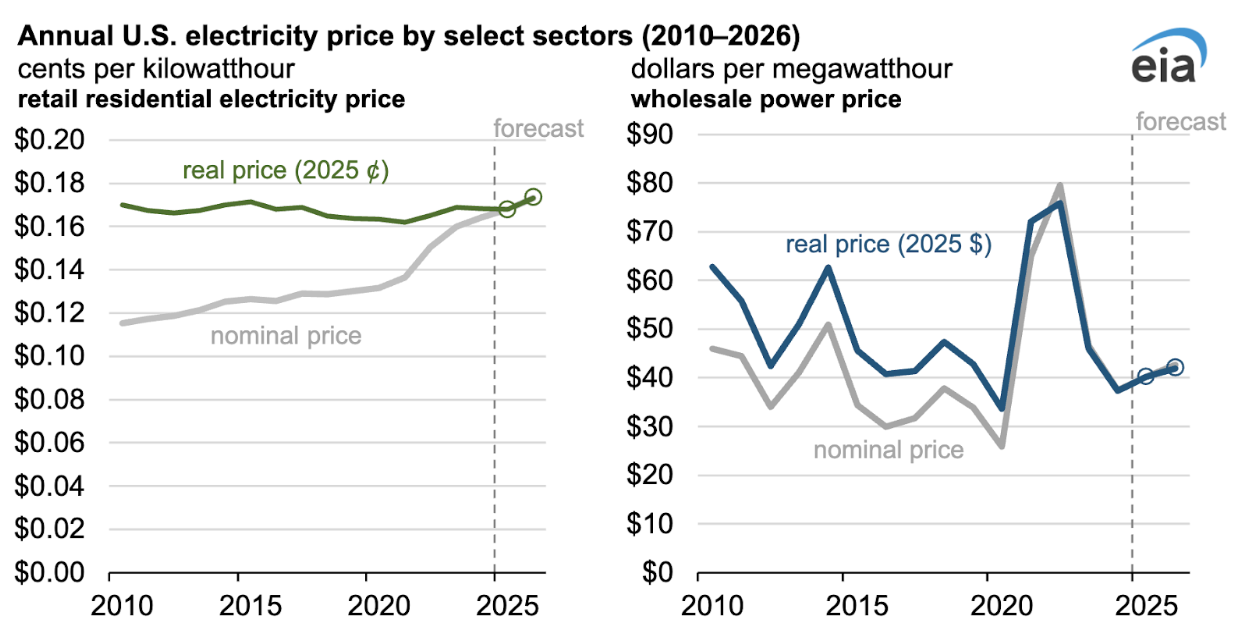
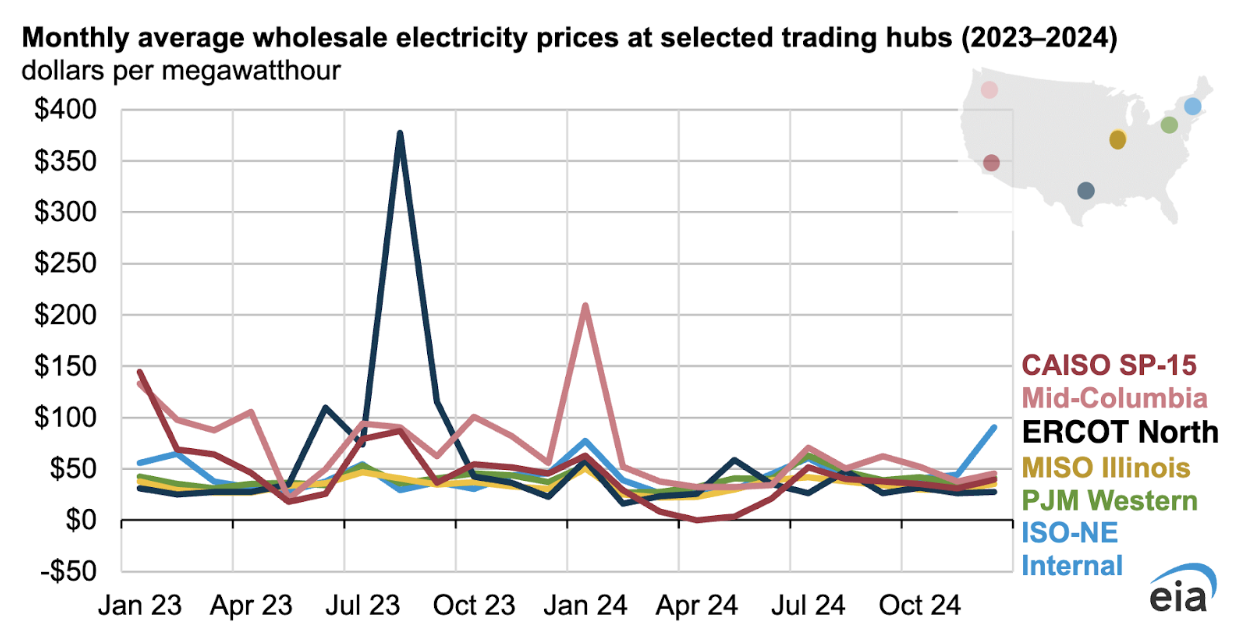
So far, wholesale power prices are not rising. The average wholesale power price was down from 2023 to 2024 at most trading hubs. But wholesale prices are volatile. An unusually hot 2023 and unusually mild 2024 could be masking structural changes in power markets. There are plenty of indications that scarcity conditions will be more frequent in coming years.
ERCOT’s regular report assessing system resource adequacy shows decreasing operating margins, with shortages occurring in 2028 and then becoming more frequent. PJM’s capacity auction cleared at record highs in 2024 and 2025, essentially sending a very strong signal that more capacity is needed to avert shortages.
Electricity rates have risen so far this decade in response to a natural gas price shock and inflation of electrical equipment prices. But as load continues to grow for the first time in almost 20 years, there is a need for additional generation investments even as manufacturing limitations promise to continue driving the cost of those investments.
Possible implications of rate increases
Every period of rising electricity rates has triggered a policy response. Electricity rates are politically sensitive because they can seriously pinch the budgets of people with low incomes and because they are a material cost driver for politically influential industrial and manufacturing firms.
One risk is that generation capacity will be overbuilt. Most of the load growth projections are highly uncertain as they depend on the capital plans of a small number of tech firms. It is easy to imagine an economic shock that causes those firms to pull back their capital plans, putting power producers in a distressed position.
If this were to happen, I can’t imagine that there would be political fallout in deregulated areas as it was only private money that was risked. Many independent power producers would go bankrupt and wholesale power prices would be depressed. This would have the effect of lowering retail electricity rates. It would be comparable to the boom in telecom investments after telecom deregulation in 1996, in which a lot of useful infrastructure was put down but many investors lost money.
But in regulated territories without wholesale markets, I could see those utility monopolies coming under significant scrutiny. Unlike in regulated areas where electricity rates would come down, regulated areas would see rates rise to pay off the construction of power plants that would sit largely unused. That disparity would be hard to ignore, and it could be a catalyst not just for the deregulation of wholesale power generation but also electricity retailing.
There could also be increased scrutiny of transmission monopolies. As transmission and distribution costs make up larger and larger portions of customer bills, very pro-competition states like Texas might become interested in alternative cost allocation mechanisms.
Finally, when rates rise there is always a renewed focus on efficiency. But since user energy efficiency is near its maximum potential (i.e. everyone has the efficient lightbulb and EnergyStar appliance), I think there will be more interest in deferring capacity investments by incentivizing demand response a load peaks.