How American Industry is Powered
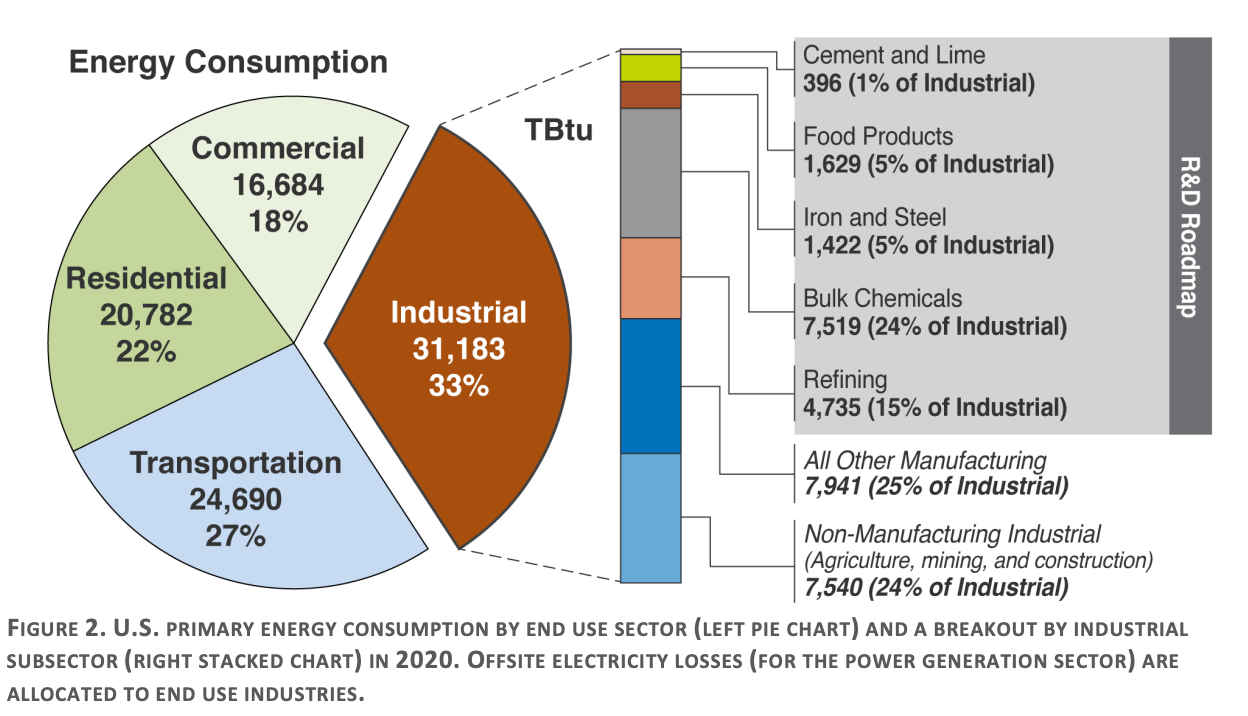
Most energy (excl. transportation) in the U.S. is used by the industrial sector - 55.8%. In 2023, the industrial sector consumed 26.1 quadrillion Btus. That’s equivalent to launching the Saturn V rocket’s first stage 1,030,000 times 1, or 114 launches per hour.
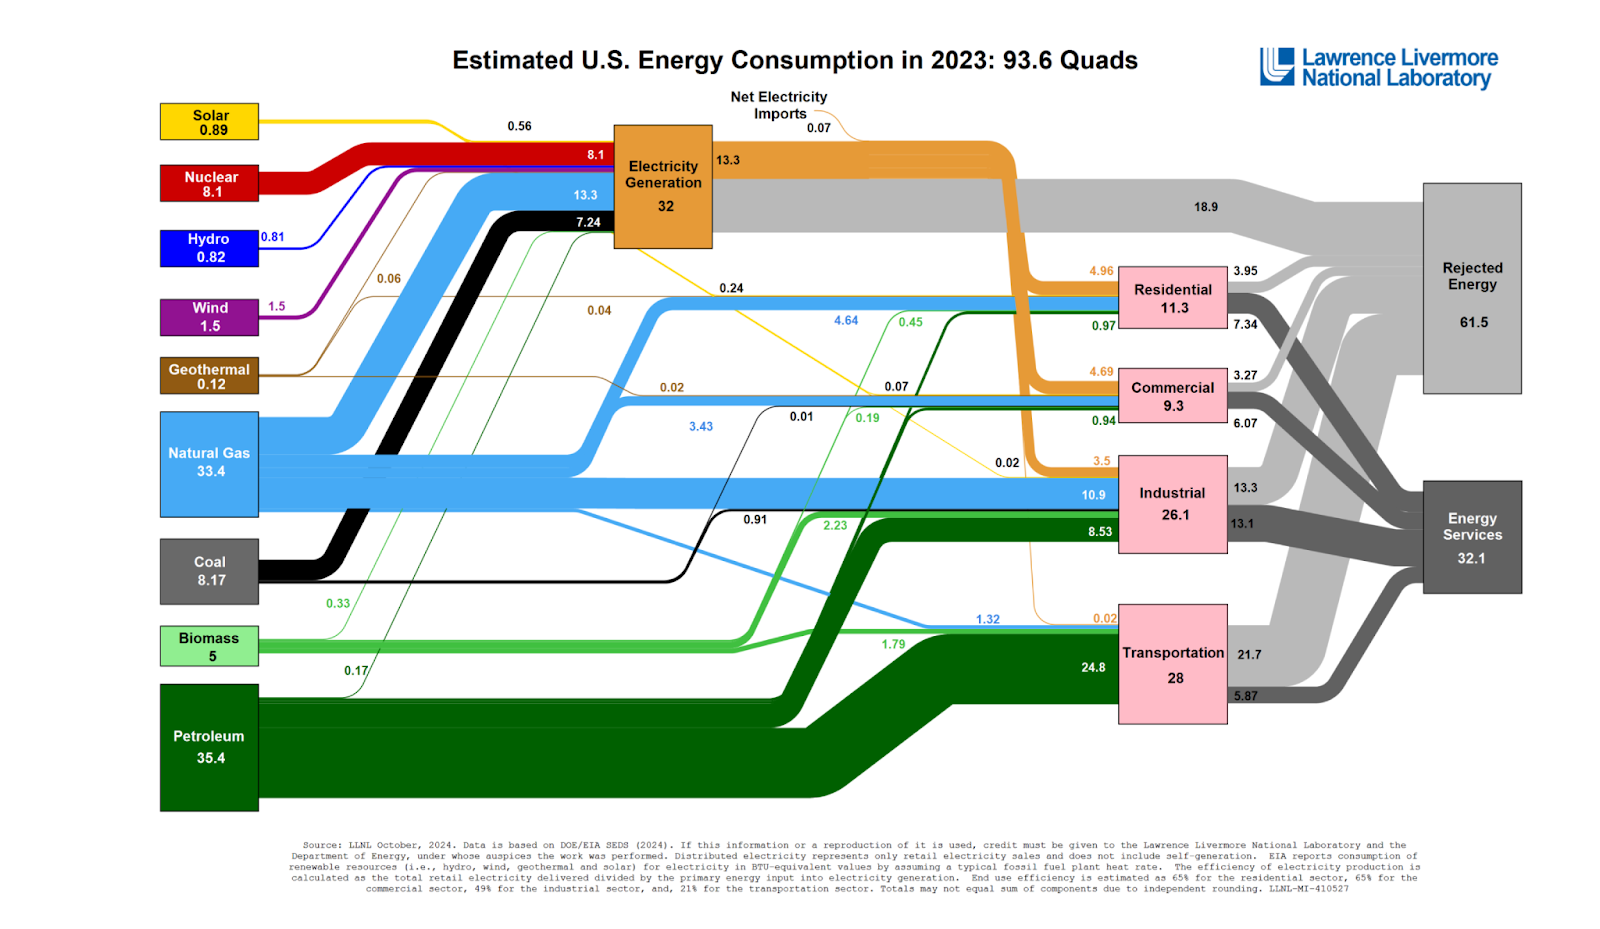
Manufacturing consumes 76% of all energy, with the remainder used in agriculture, mining, and construction 2.
Before diving into how that’s split up by industry and physical activity, and what fuels power it, let’s set the stage with an overview of the manufacturing sector. The North American Industry Classification System lists 21 manufacturing sub-sectors (for readability I’ll call them industries), and there are lots of official statistics available about the activities of these industries and their sub-industries. The Census Bureau puts out an Annual Survey of Manufacturers, and the EIA puts out a less frequent Manufacturing Energy Consumption Survey. From the Census Bureau, here’s every manufacturing industry ordered by the value of shipments in 2019:
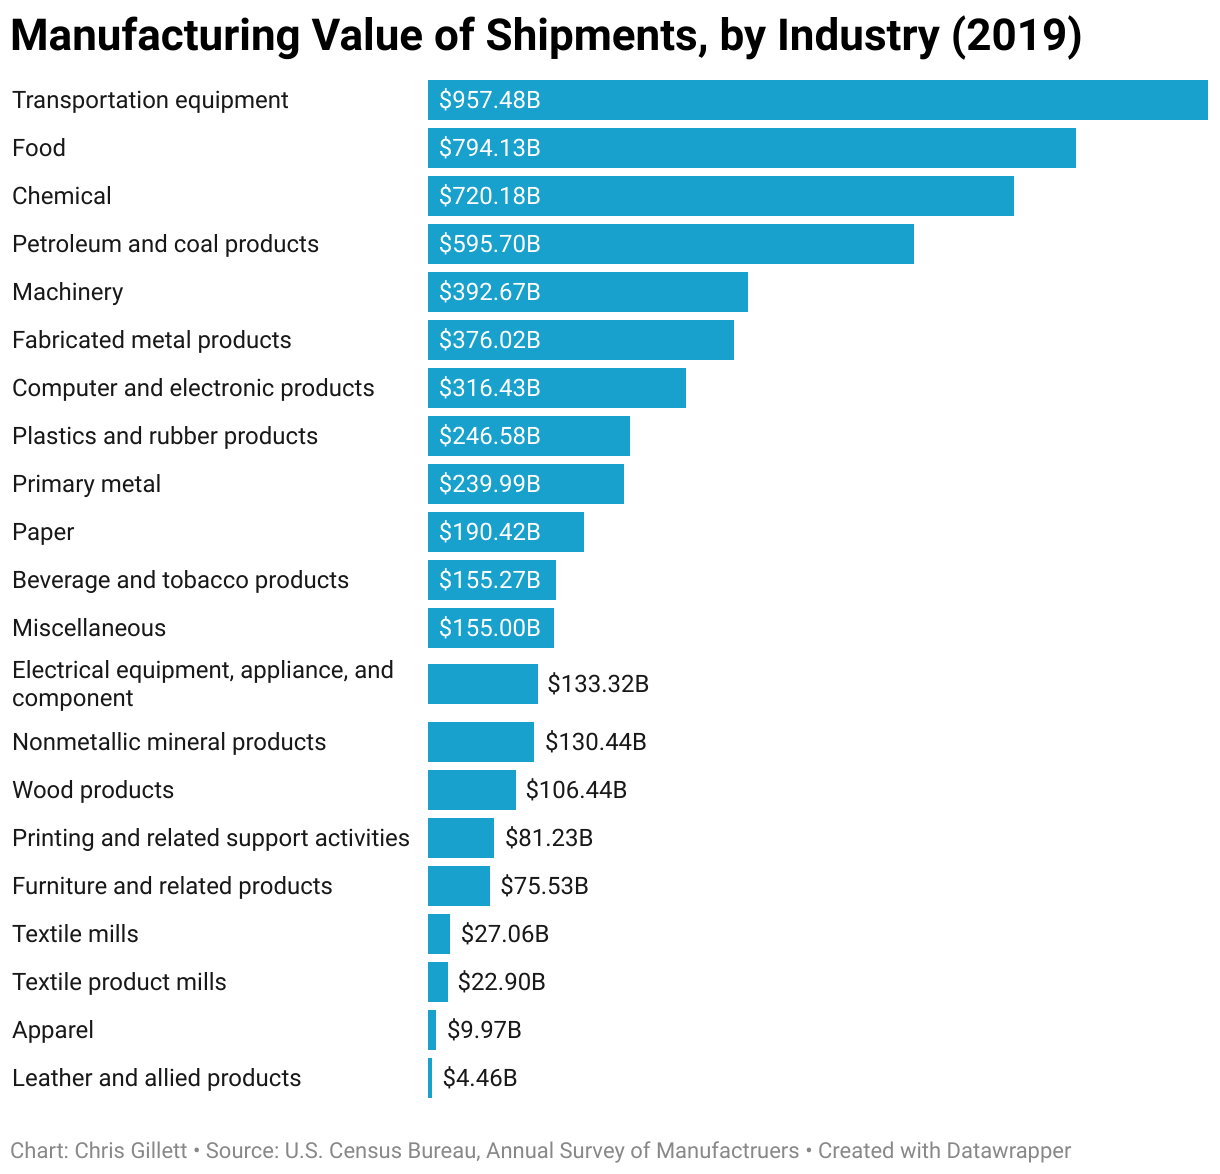
I’ll highlight a few industries so that we know what we’re talking about before we get into energy consumption. The computer and electronic products industry is 49% “navigational, measuring, medical, and control instruments”, 31% semiconductors3, 11% communications equipment, and 7% computers and peripherals. Plastics and rubber products are split 82% plastics and 18% rubber. Beverages and tobacco are split 70% beverages and 30% tobacco.
The next graph is a scatterplot comparing the shipped value of each sub-sector with the number of plants in the sub-sector.
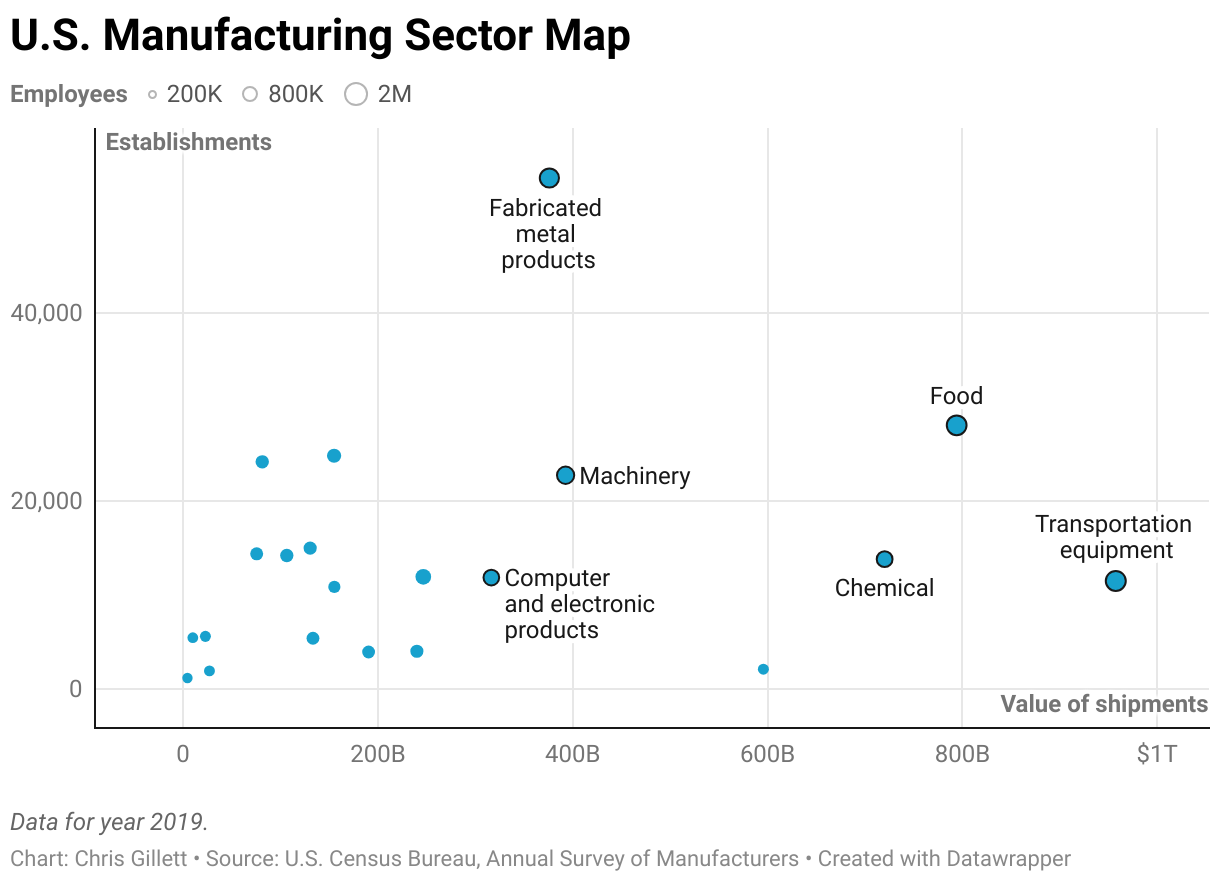
Highly centralized manufacturing industries include petroleum and coal, primary metals (39% steel and iron mills, 13% foundries), transportation equipment (36% motor vehicles, 27% motor vehicle parts, 24% aerospace, and 4% ships and boats), chemicals (29% basic chemicals that are used as inputs by other manufacturers, 29% pharmaceuticals and medical chemicals, and 12% soap and cleaning products), and paper mills.
Highly decentralized manufacturing industries include fabricated metal products (36% architectural and structural materials; 26% nuts, bolts, etc.; 14% boilers, tanks, and shipping containers; and so on), food (28% meat, 15% dairy, 10% grain and oil seed milling, 9% fruits and vegetables, 9% baked goods, and then sugar, seafood, and animal food), and machinery (24% agricultural, construction, and mining equipment; HVAC and commercial refrigeration; 12% engines, turbines, and power transmission equipment; 9% industrial machinery, and 8% metalworking machines).
Now let’s focus on energy consumption. Here’s the total energy consumption of each manufacturing industry. The non-electricity portion of energy includes fuels like natural gas, coal, and fuel oils. The dots show electricity’s percent of energy use for each sub-sector.
Less energy-consuming manufacturing industries use more electricity as a percent of their total energy consumption. My guess is that this has to do with the ratio of process versus non-process activities. Process activities are directly involved in carrying out manufacturing, while non-process activities are general facility support activities that aren’t unique to manufacturing, like lighting and HVAC. Non-process activities are more electrified and they scale linearly with the facility size (or the total square footage of the industry), whereas process activities are much less electrified and consume large quantities of energy regardless of the facility size. Facilities with a higher ratio of process activities will tend to consume more energy overall and have a lower share of energy from electricity.
The graph below shows the proportion of each industry’s energy consumption from process activities, non process activities, and indirect uses4. The industries are in the same order as above, sorted from most energy use to least, and the dot represents the percent of energy from electricity.
Like we’d expect, industries using a greater proportion of energy on non-process activities have higher electrification rates. But within these categories there is some variation. For example, machine drive - a process activity - is highly electrified because electric motors offer more precision, control, and faster starting/stopping.
The graph below shows the types of activities measured in the EIA’s survey of manufacturers, including the amount of power consumed by the activity, the breakdown of which fuels provide the energy, and the percent of energy coming from electricity.
Process heating accounts for about 50% of all onsite energy use5. The reason its proportion is so high is that it’s both ubiquitous and inherently energy-intensive. It’s ubiquitous because heat is a necessary ingredient in any modification of materials and chemistries - melting, refining, pasteurizing, drying, etc. And it’s energy-intensive because significant heat losses occur in transfer.
Natural gas is the preferred fuel for generating process heat because it burns cleanly and controllably, can achieve a high temperature, and there is significant natural gas production and transportation infrastructure in the US. Heat can be generated with electricity, and electric heating can be controlled more precisely than gas-fueled heat, but it’s overall less efficient because of generation and transmission losses.
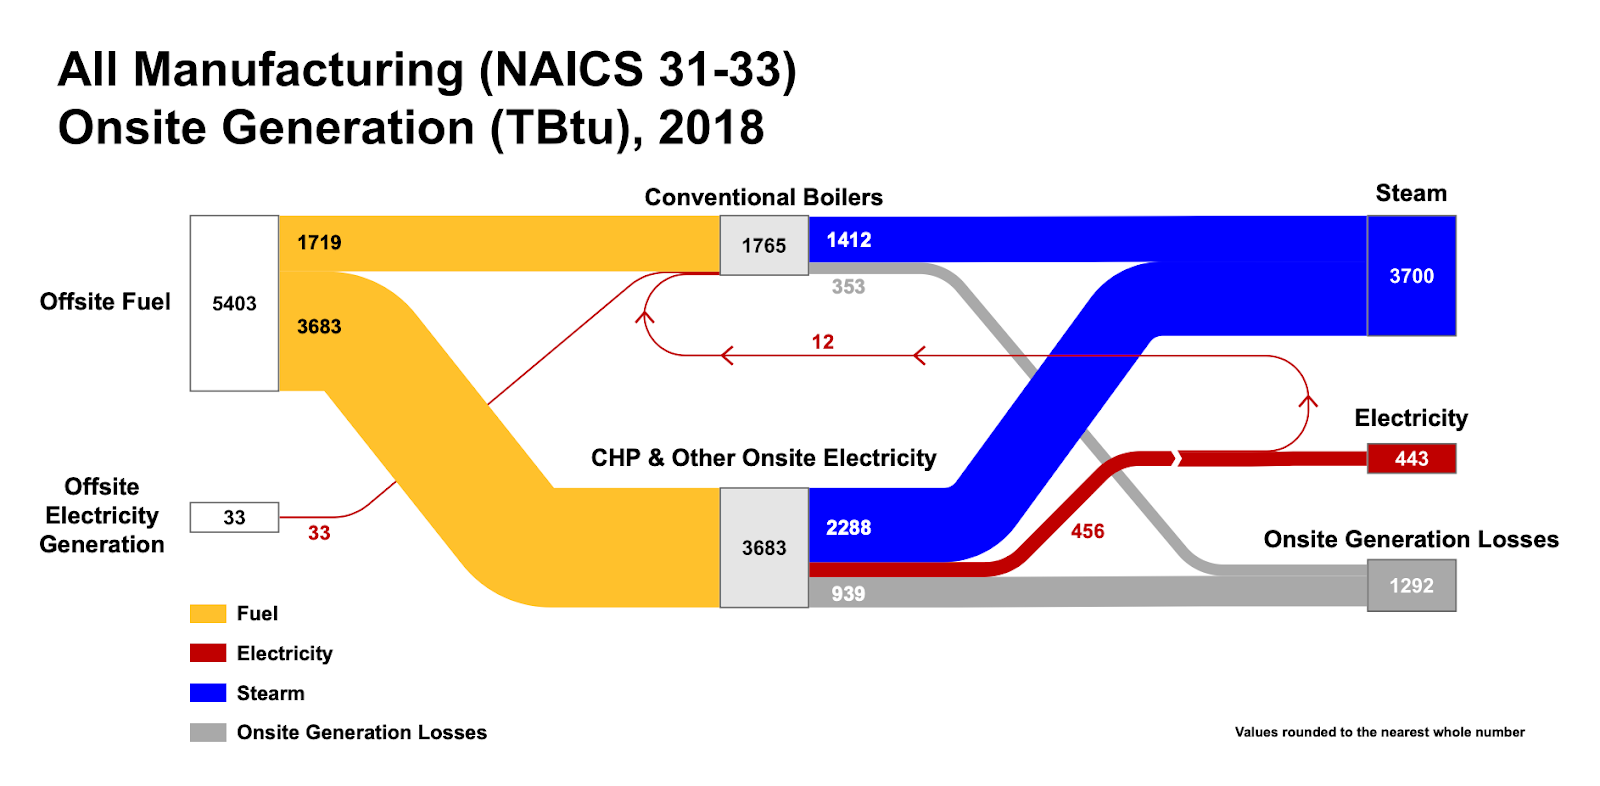
Combined Heat and Power (CHP) and Conventional Boiler Use both generate steam, which is primarily used for process heat, and CHP also generate on-site electricity. As mentioned above, it’s difficult for manufacturers to account for how this energy is used once converted to electricity and steam, so it’s not broken down further. We’ll explore this in more detail soon.
Machine drive uses a lot of energy because it’s ubiquitous. Motors - conversions of thermal or electric energy to mechanical energy - are involved in every part of the manufacturing process. This activity is highly electrified because electric motors offer much greater precision and control, they run quieter, and they are available in many sizes and types. In fact, the electrification of motor drive was a pivotal period in manufacturing history. For example, electric conveyor belts, with their fast starting and stopping, made assembly lines practical. Ford Motors was an early adopter.
The two remaining minor process activities - cooling and electro-chemical processes - are powered by electrical energy. Cooling is electrically powered because AC compressors run on electricity, but they don’t consume much energy in the aggregate because cooling is less common than heating in manufacturing. Electro-chemical processes are electric by definition, but also not so common.
The next graph shows the proportion of each industry’s energy use by the specific activity consuming the power.
The highly energy-consumptive sectors use a lot of process heat and CHP. These are also relatively “simple” manufacturing processes. Chemicals, petroleum and coal, metals, paper, and nonmetallic minerals (cement, ceramics, glass, etc.) require a lot more heat than moving parts. And more complex processes, requiring more steps and more human touches - vehicles, machinery, computer and electronics equipment, furniture, textiles, apparel, etc. - use a greater proportion of machine drive.
Are these more complicated manufacturing processes more valuable? The relationship isn’t clear. The below graph compares energy consumption and value of shipments for all manufacturing sectors.

Although chemical and food production have similar outputs in dollars, $720B and $794B, they consume very different amounts of energy, 3.1 quadrillion Btus (a whopping 3.3% of total U.S. energy consumption) for chemicals versus 1.1 quadrillion Btus for the more valuable food sector. This indicates that the value of energy inputs is not the primary factor determining the value of the manufacturing process.
Another way to look at this is to measure the energy-intensity of different sectors. Energy-intensity is energy consumption divided by the value of output - how much energy is required to produce $1 of shipped value.
Four industries are clearly more energy-intensive than the rest - nonmetallic mineral products, paper, primary metals, and chemicals. What these seem to have in common is that they produce basic or intermediate goods, and their manufacturing process primarily involves applying heat to raw inputs. It seems intuitive that the output value of such a ‘simple’ process would closely track the value of its primary inputs: materials and energy.
On the other hand, manufacturing industries with more complex outputs - finished goods requiring hand assembly - require less energy per dollar of output because the value of their outputs comes from labor and design. In other words, a cement factory is probably highly conscious of their energy costs, while a car factory is much more worried about labor, the complex supply chain for your many inputs, etc.
Does that mean that more complex manufacturing processes consume less energy? Sort of. Production of basic inputs requires a lot of process heat, which inherently consumes a lot of energy. But if you look at just consumption of electrical energy, it’s more mixed. The graph below shows electricity consumption by sector, broken down by the source of the electricity.
Chemicals, primary metals, and paper are still highly energy consumptive, but so are food and transportation equipment. Sectors that have cheap access to fuel will tend to self-generate electricity. Petroleum and coal manufacturers will have waste products that can be burned for fuel. Something similar must be going on with chemicals, which is also a very petroleum-related sector. And in paper manufacturing, trees are a raw input but they have to be de-barked first and that bark can be burned to generate electricity. (Maybe Enron getting into paper manufacturing wasn’t as random as the book made it seem).
The Department of Energy has energy flow diagrams that bring all of this together. Starting with the high level flow, we see that all fuel comes from offsite, the vast majority of steam is produced onsite, and the vast majority of electricity comes from offsite. 88% of energy is consumed by processes (as opposed to non-process facility support).
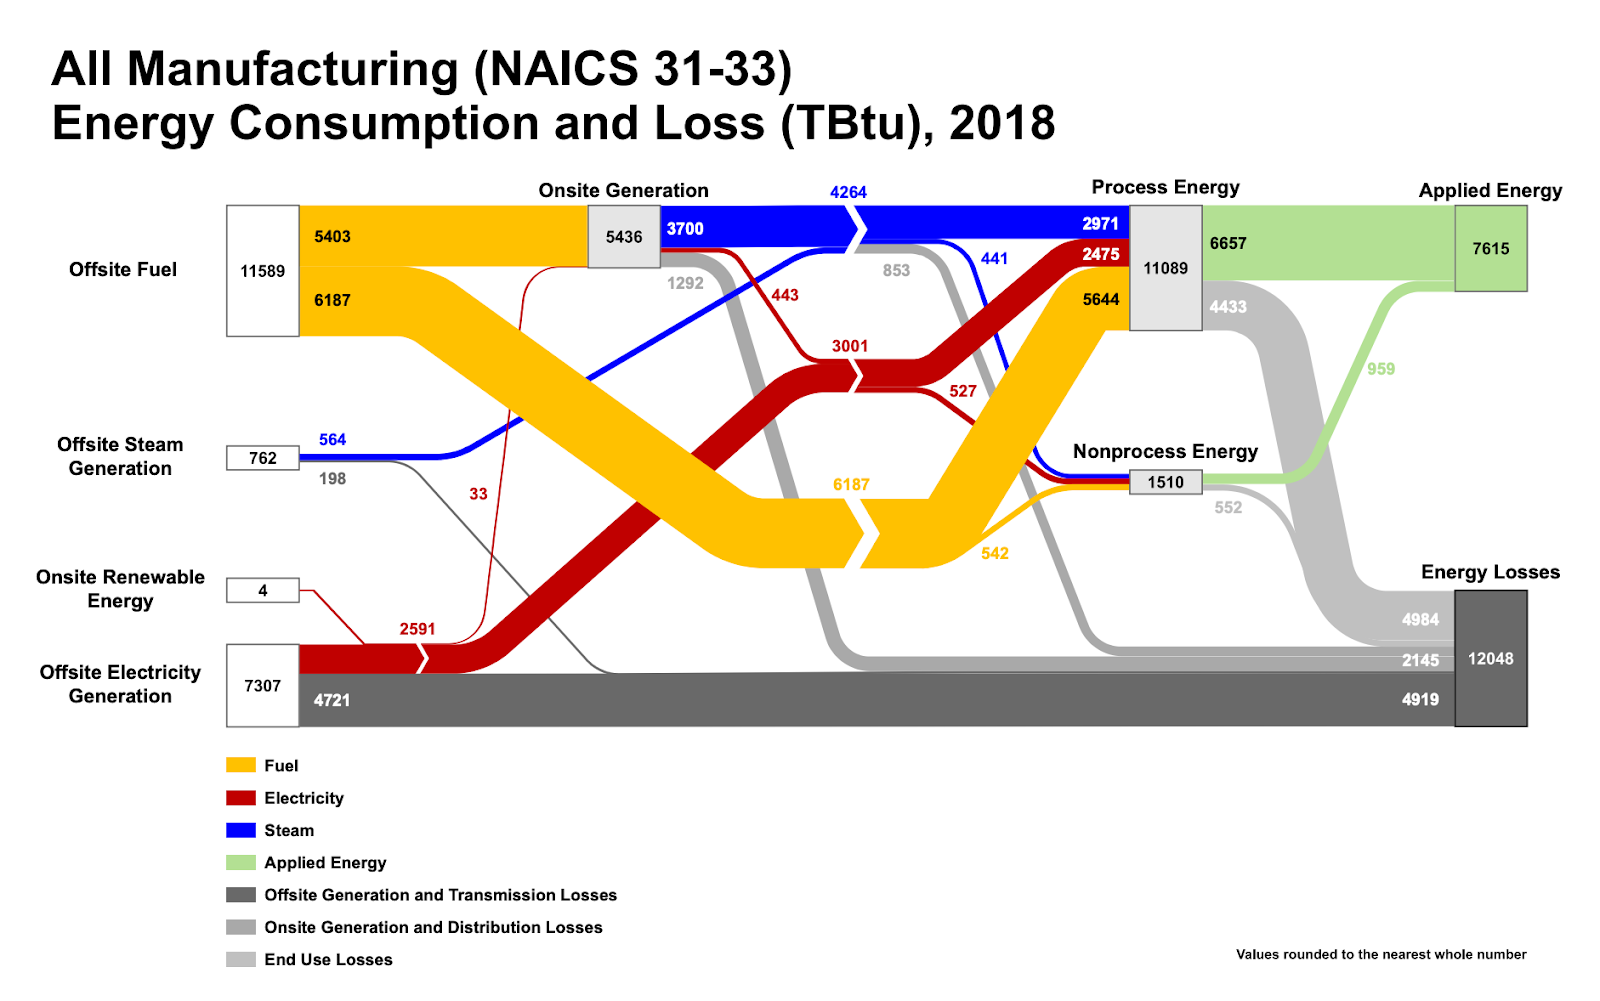
Steam is mostly (62%) generated through electricity generation. This has the advantage of also generating electricity.
-
The Saturn V consumed 1.66 x 10¹¹ watts for 161 seconds, equivalent to 7.424 GWh. The EIA estimates the energy consumption of the US industrial sector to be 26.1 quadrillion Btu in 2018, equivalent to 7.649 million GWh. So the US industrial sector consumed as much power as 1.03 million Saturn V first stage launches, or 114.2 launches per hour. ↩
-
Observant readers may notice that the number on the top two charts differ slightly. They’re for different years and from different sources. ↩
-
Note that there has been significant investment in semiconductor manufacturing since this census was done in 2019. ↩
-
The “indirect uses” category is for energy used to produce steam with boilers. The steam is then used for process or space heating, or for producing electricity. But it’s hard for manufacturers to account for how much energy is used for what purpose once it’s converted to steam, so this is all bundled into the “indirect uses” category. ↩
-
https://www.energy.gov/eere/iedo/manufacturing-energy-and-carbon-footprints-2018-mecs?nrg_redirect=458016 ↩